Visualizing COVID-19 with Pandas & MatPlotLib
Learn how to analyze and visualize COVID-19 Data with 4 complete graphs to track our insights as we build charts together.
Get Started
TECHNOLOGIES
WATCH TIME
39 minutes
LEVEL
Overview
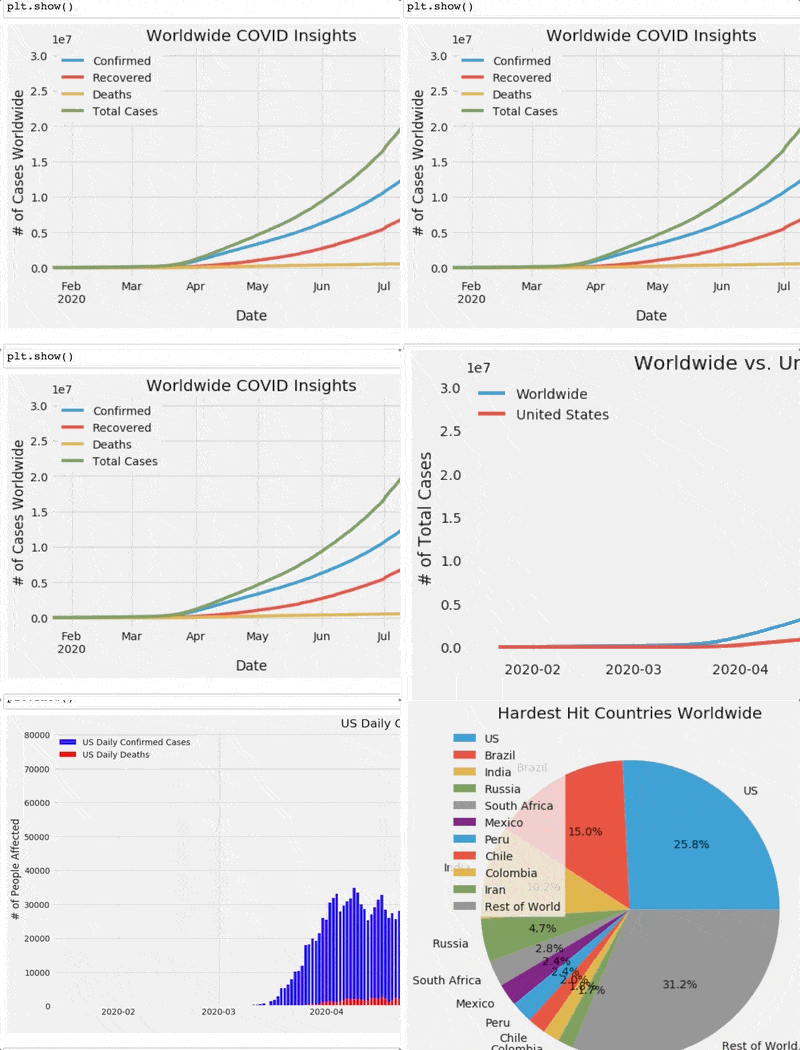
Welcome to a beginner-friendly Python and Data Science project that’s all about analyzing and visualizing current COVID-19 data. We’re focused on building 4 complete charts that will analyze both Worldwide trends and insights from a country of your choosing. We’ll learn how to analyze our CSV with Pandas, manipulate columns and apply various Pandas functions, and then visualize our results through line charts, stacked bar charts and pie charts with MatPlotLib.
Project Tasks
Welcome to the project!
2 min
Gathering our data & plotting Total World Cases
Learn how to analyze and visualize COVID-19 Data with 4 complete graphs to track our insights as we build charts together.
12 min
Worst Hit Countries by COVID-19
Welcome to a beginner-friendly Python and Data Science project that’s all about analyzing and visualizing current COVID-19 data. We’re focused on building 4 complete charts that will analyze both Worl...
9 min
United States vs. Worldwide Cases
Welcome to a beginner-friendly Python and Data Science project that’s all about analyzing and visualizing current COVID-19 data. We’re focused on building 4 complete charts that will analyze both Worl...
7 min
Daily United States Cases and Deaths
Welcome to a beginner-friendly Python and Data Science project that’s all about analyzing and visualizing current COVID-19 data. We’re focused on building 4 complete charts that will analyze both Worl...
11 min