Bitcoin Cryptocurrency Price Visualization
Build and publish an interactive Plotly chart for Bitcoin Prices by pulling and caching data from multiple exchanges using Quandl!
Get Started
TECHNOLOGIES
WATCH TIME
38 minutes
LEVEL
Overview
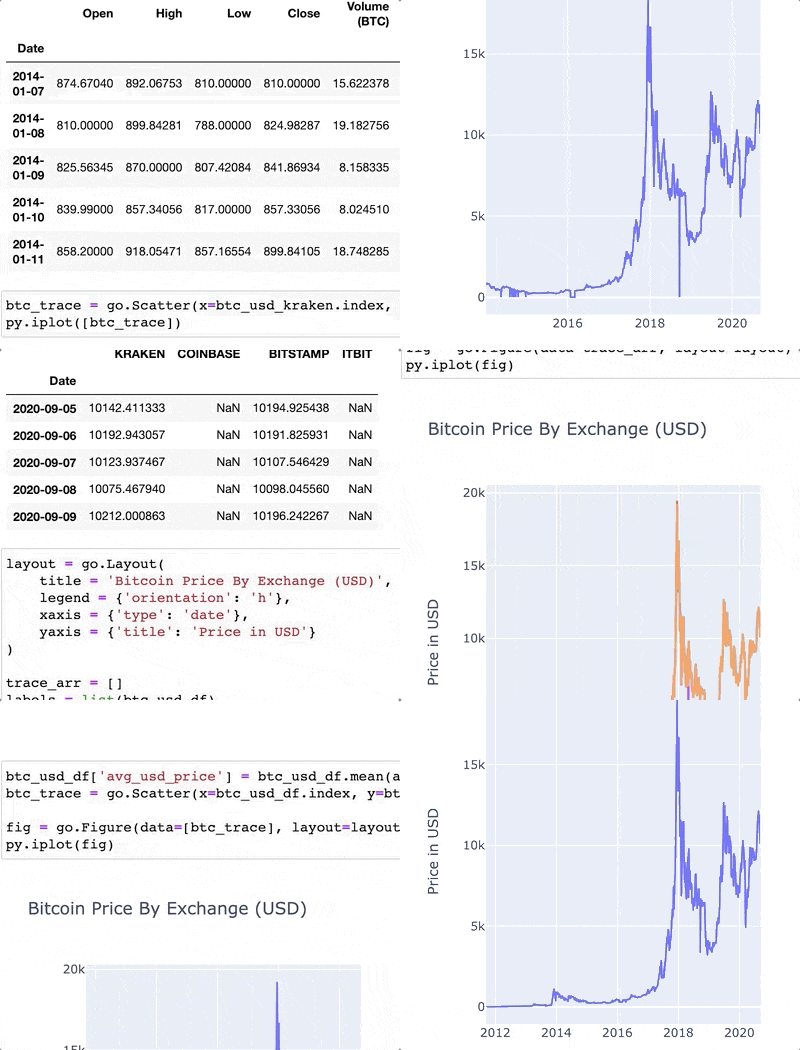
Welcome to a beginner-friendly Python and Data Science project that’s all about analyzing and visualizing Bitcoin Cryptocurrency Prices over the years. We’re going to use a different visualization tool, Plotly, to render an interactive price chart of Bitcoin. We’ll also apply a useful caching technique with Pickle to cache Bitcoin datasets on our machine, and finally upload our chart online with Plotly Chart Online, for anyone in the world to see our chart.
Project Tasks
Welcome to the project!
2 min
Displaying our Plotly Chart online
Build and publish an interactive Plotly chart for Bitcoin Prices by pulling and caching data from multiple exchanges using Quandl!
6 min
Getting Data from Multiple Exchanges
Build and publish an interactive Plotly chart for Bitcoin Prices by pulling and caching data from multiple exchanges using Quandl!
12 min
Retrieving and Caching Bitcoin Data
Build and publish an interactive Plotly chart for Bitcoin Prices by pulling and caching data from multiple exchanges using Quandl!
11 min
Averaging and Visualizing our Bitcoin Prices
Build and publish an interactive Plotly chart for Bitcoin Prices by pulling and caching data from multiple exchanges using Quandl!
9 min